Modal Assurance Criterion (MAC)
Once identified from data, natural frequencies, damping ratios and mode shapes are usually validated with simple metrics e.g. with their standard deviations or relative errors between the estimates from different model orders in a stabilization diagram.
When it comes to the mode shapes some additional indicators are commonly used; one of them is Modal Assurance Criterion (MAC). MAC depicts a degree of collinearity between two mode shape vectors and its value is a real scalar bounded by 0 and 1. MAC can be deployed for the comparison of two mode shapes estimated from a single model order, between different model orders, between two global model orders, between different data sets and lastly between the mode shape extracted from the finite element model and the mode shape estimated from the data collected from the corresponding structure.
For two mode shapes psi_r and psi_s, the scalar MAC value is defined as:
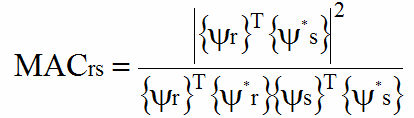
When the mode shapes correspond to different modes, the MAC estimate is inside the interval 0 and 1. When the mode shapes correspond to the same mode, the resultant MAC estimate is close to 1, however it never reaches 1 unless the same mode shape vectors are compared.
Modal Assurance Criterion window
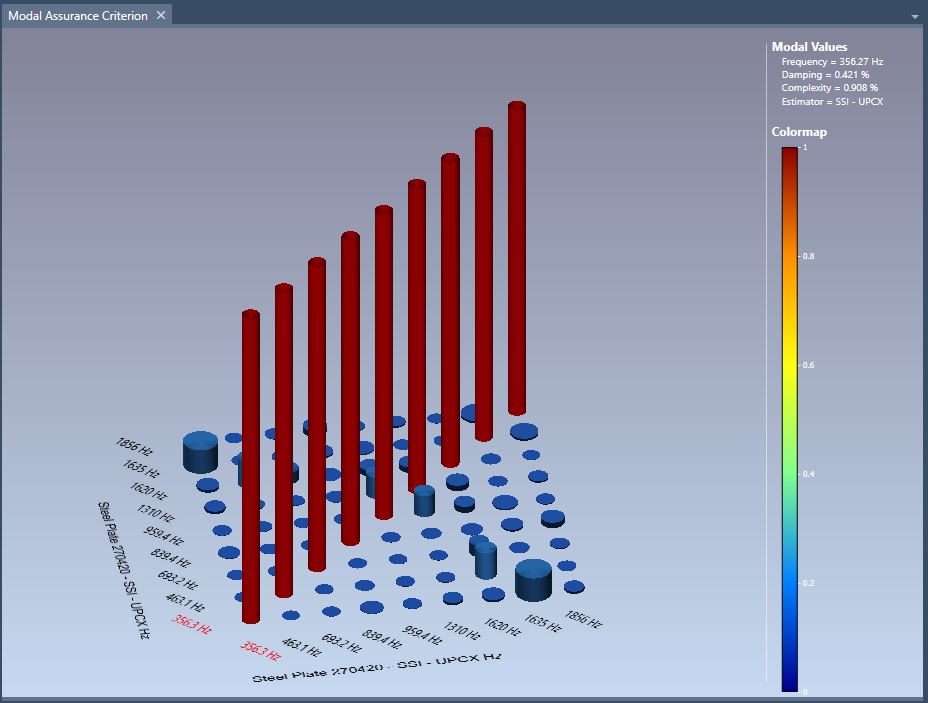
In any of the Modal Estimator Tasks as well as in the Validate Task it is possible to see the MAC displayed in a 3D graphical representation

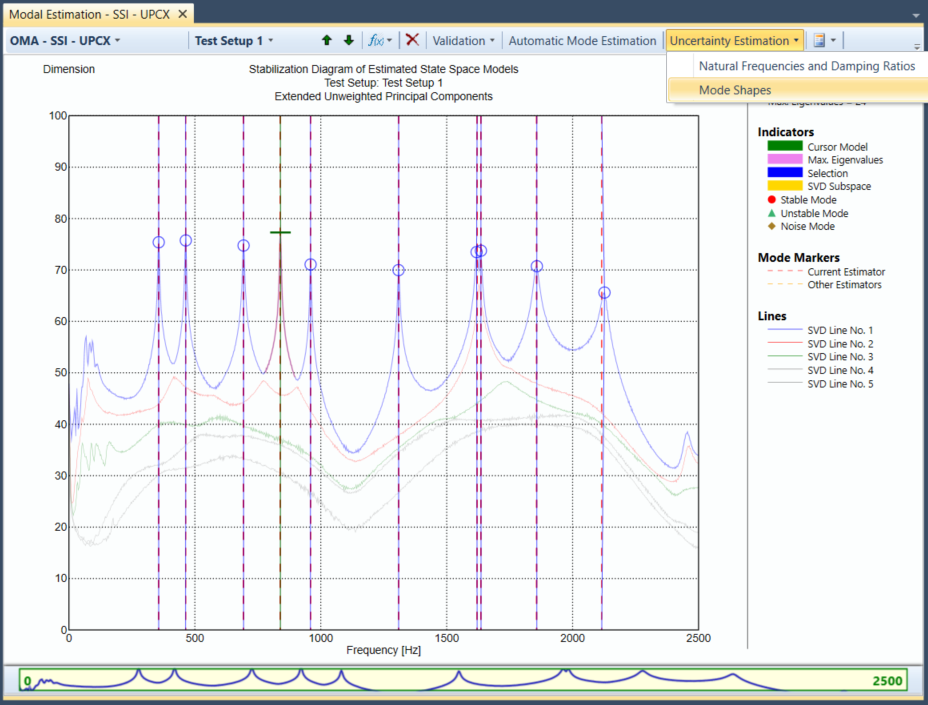
If the MAC diagram is accessed from the Modal Estimation Task, the window illustrates the MAC values between the modes estimated with the chosen system identification method.
If the MAC diagram is accessed from the Validate Task, the MAC window can illustrate either the MAC computed between the mode shapes estimated from one system identification approach, or MAC computed between two different sets of estimators.
In the MAC diagram is accessed from the Modal Estimation Task, the MAC window can be found in the Application Task Bar.
Different display properties of the Modal Assurance Criterion window can be toggled with the Properties window.
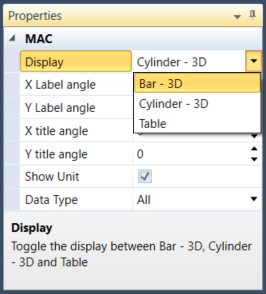
The Bar-3D diagram is a classic display, which was shown on Figure before.
Selecting Cylinder-3D outputs the following cylinder diagram
Selecting Table view outputs the following table
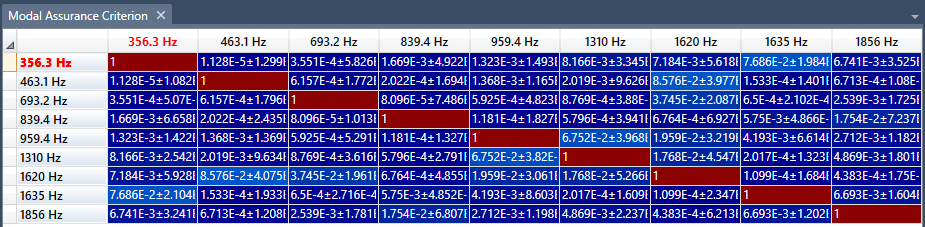
The coloring of each cell correspond to the color of the MAC 3D view. Returning back to the 3D view can be done with the button MAC 3D from the toolbar.
One can see that apart from the MAC, its standard deviation can be computed as well. This is elaborated in the next paragraph.
Uncertainty of Modal Assurance Criterion
As any estimate from data, the MAC and the underlying mode shape components are perturbed with statistical uncertainty. This uncertainty can be quantified by propagating the variance of the measurements onto the parameters estimates with the first order delta method.
In ARTeMIS, the uncertainty can be evaluated for the estimates of natural frequencies, damping ratios and mode shapes, which is available in SSI-UPCX method.
After the mode shape uncertainty is computed, it can be propagated to the MAC with the first order delta method.
Note that auto-MAC located on the diagonal of the MAC matrix yields always 1 and has no uncertainty.
The uncertainty of the cross-MAC is quantified with the delta method, and illustrated on the MAC diagram in the width direction of each bar or cylinder. Bars or cylinders with larger widths exhibit higher uncertainties, as it can be viewed on the previous Figures. One can also find the standard deviation of the MAC in the table view.
See Also